|
Module 1 - Chartwork |
|||
|
The objective of this Module is to familiarize you with Charts, including
These skills are the basis of navigation at sea and we will build on them in Module 3 Navigation. Paper charts do a difficult job very well indeed. They have to represent the curved surface of the sea and land on a flat chart table! and be accurate enough for us to pick our way into a harbour in the dark. They show
In addition they also have information about tides, currents, shipping lanes and notes about anything relevant to navigating in that area. Read this section in conjunction with Symbols booklet (Chart 5011)
and the chart. On the back cover of 5011 you will see a quick reference
guide. Very useful! It does take a while to gain familiarity with the
numerous symbols, so keep the 5011 very near to hand! Symbols on electronic charts are similar but not quite always the same ( Crazy huu?!) So load up your electronic plotter with the code and have a look. When you
have it loaded on your machine ( ask me if you get stuck it’s no trouble)
click your windows start button and type nuno. You
have two options. Choose nuno how-to then
understand the chart then symbols. This little guy is well worth
understanding for example.
The first thing to do, every time you look at a new chart is check the scale. Bear in mind that over a days passage you may use ten of them, all with different scales! Look at the scale! On your practice charts, you have two different scales. Chart 1 is 1: 150,000 and chart 2 is 1:75,000.(You can see this in the notes below the chart’s name). These numbers are all very useful to the chart maker, but to get a mental picture of our chart , we must know how big an area it covers in Nautical miles. These are nothing to do with statute miles, yards, feet, inches etc. Those measurements have been arrived at by rather haphazard methods, e.g. the "length of a man’s arm or his foot!" A nautical mile is completely different. It is derived from 1 minute of Latitude. Read on. Lots knocked out here Nautical charts are published by a number of different agencies, but mainly by National bodies of Maritime nations. In the UK, this is the Hydrographer of the Navy. He produces charts for not only our home waters, but for just about the whole world: a mammoth task done very fastidiously indeed! There are other commercial chart makers. Some you may come across are: - "Imray" and "Stamford" charts. These charts are based on the Admiralty charts mentioned above and also give other "Yachting information" on the reverse of the charts. These do not always have the same level of detail as Admiralty charts. For the purpose of this course, we will be using British Admiralty Charts. All charts are only as good as the last time they were corrected and brought up to date. Obviously it would be very dangerous indeed to be using a chart that was out of date. Imagine sailing along in supposed safety, then running straight into a new wreck that is not on your chart yet! The Admiralty produces chart corrections in the form of weekly "Notices to mariners", which cover all the charts and publications they produce. They also produce a three monthly Small Craft Edition of the notices for home waters, but these are only available on the Hydrographers web site www.ukho.gov.uk . Each correction has its own number. Look at the bottom left hand corner of the chart, in the lower margin. You will see "small corrections", the years in which the corrections (various numbers) were placed on the chart. When you make a correction, make a note of it here. Chart corrections are normally done in Magenta pen to make sure they stand out. Like me, you probably haven’t got one! Charts and Admiralty Notices to Mariners are available from Admiralty chart agents. Stamford and Imray charts are also available from bookshops and Yacht chandlers. ELECTRONIC CHARTS are also available on computer screen via Compact or floppy disc. These systems are very definitely here to stay. You need a computer on
board to run them but hey that’s almost a given these days. This seems very
expensive, but you are using a computer now! Most people have a laptop
already so these charts are often a cheaper alternative than buying paper
ones. Some of the advantages of this kind of charts are
You can do most of the normal navigational duties with this kind of chart eg, measuring the range and bearing from a charted object, but there are some disadvantages
More on this subject when we get to module three.
I have already mentioned that charts do a difficult job very well, in that they display a curved, in fact spherical object onto a flat piece of paper. To understand how to measure distance accurately, you need to understand a little about how this is achieved. Mercator Projection is the name given to the method of drawing charts for coastal work in most instances. Look at a chart. Can you can see that all the meridians of Longitude go straight from the top to the bottom? "Hang on" you’re thinking, I just said they were like the segments of an orange! They are like the orange in reality, but they cannot be drawn that way. Instead the Longitude is pried apart at the top and bottom, so the meridians are parallel. This makes the land within those lines much fatter! To give the land the correct shape, the chart maker stretches the Latitude accordingly. All this is not your concern except that the size of one minute of Latitude (One Nautical mile) appears to increase as you go north. So, always measure mileage at the Latitude you are situated at
(opposite your position). This method of chart making becomes unrealistic at very high Latitudes and for covering very large distances. As a Day skipper you will be doing neither of these, but the method used for these purposes is called "Gnomonic projection" To recognise these charts, Parallels of Latitude appear as curves and Meridians as parallel lines. Very large-scale charts (harbour plans) also use this projection, but on these the meridians and parallels look straight because the chart covers such a small area.
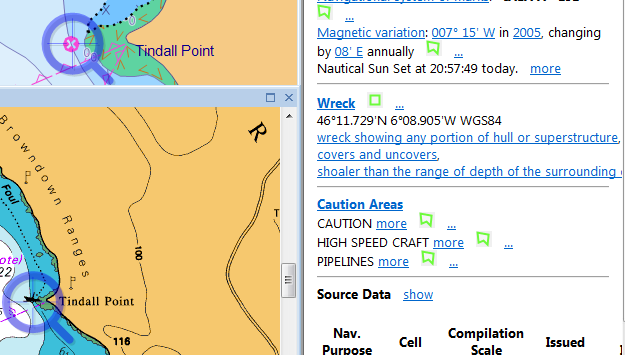
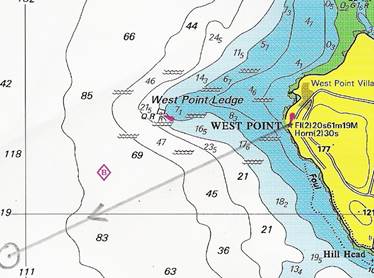
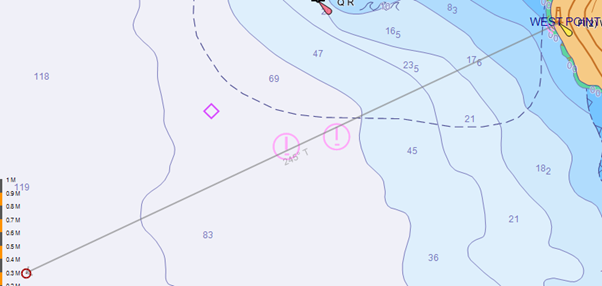
The first method above has a few disadvantages, but is used widely. When using Latitude and Longitude, it is all too easy to get the numbers muddled and therefore make a terrible error. Numbers like these mean nothing to anyone until they are plotted, but a "Range and Bearing FROM a charted object" immediately gives the navigator or rescue service an idea of where you are, eg, "Position West point light 245°T 4.4miles" Immediately, without even looking at the chart, you have a mental picture of where that place is.
If we know where west point lights is (it is a good idea to use prominent coastal features which are widely known), then we can get an idea of the position straight away. Note that west point lighthouse is 61 metres high! very prominent. Breton Plotter" to do this one, so bear with me or see Bretton plotter.but come back here afterwards. Or we just click and drag a line on the electronic cheating machine. The line tool you will find top right on your screen
|