|
Module 3 - Navigation |
|
In this module we are going to learn how to get from A to B and to keep a
track of where we are when there is nothing to fix with. Nothing to see but
sea! Navigating. Topics covered in this module are
l
There are a few terms and standard notation to learn first:
Leeway is the angle between the vessels course steered and its water track. On some courses, particularly when the wind is on the beam or forward of
it, our water track is governed by two forces: Lots missed out here, but we learn on paper charts and electronic ones too. I hope you get where I’m coming
from here. We MUST be able to draw on an electronic chart just like any
other. Electronic charts are not car sat navs! The
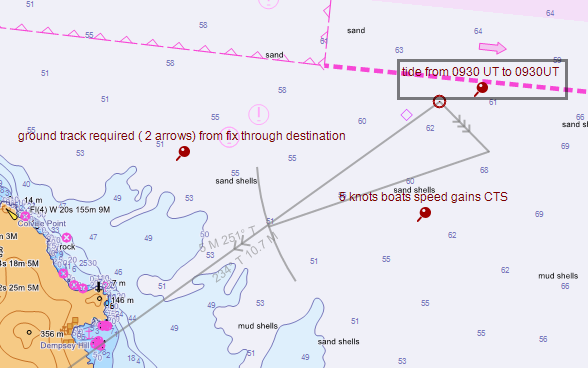
road moves so we have to be able to plot vectors to gain a CTS. The great
thing is we don’t need to look for the pencil under the chart table every
time we need it! Arg! When we find it the points
broken off again. Where’s the pencil sharpener? grr!!!
Just click and drag. Easy life.
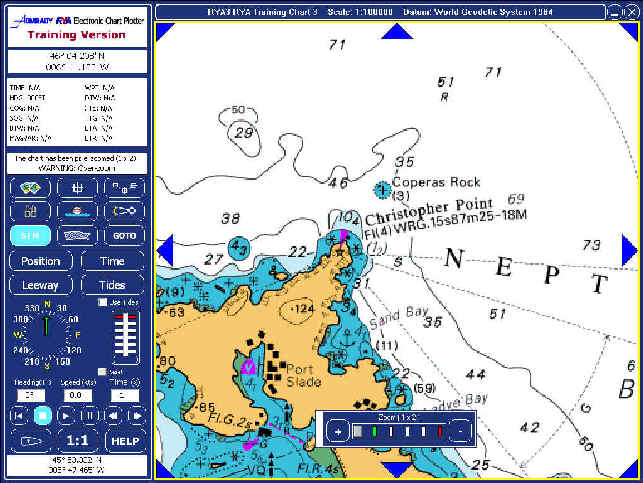
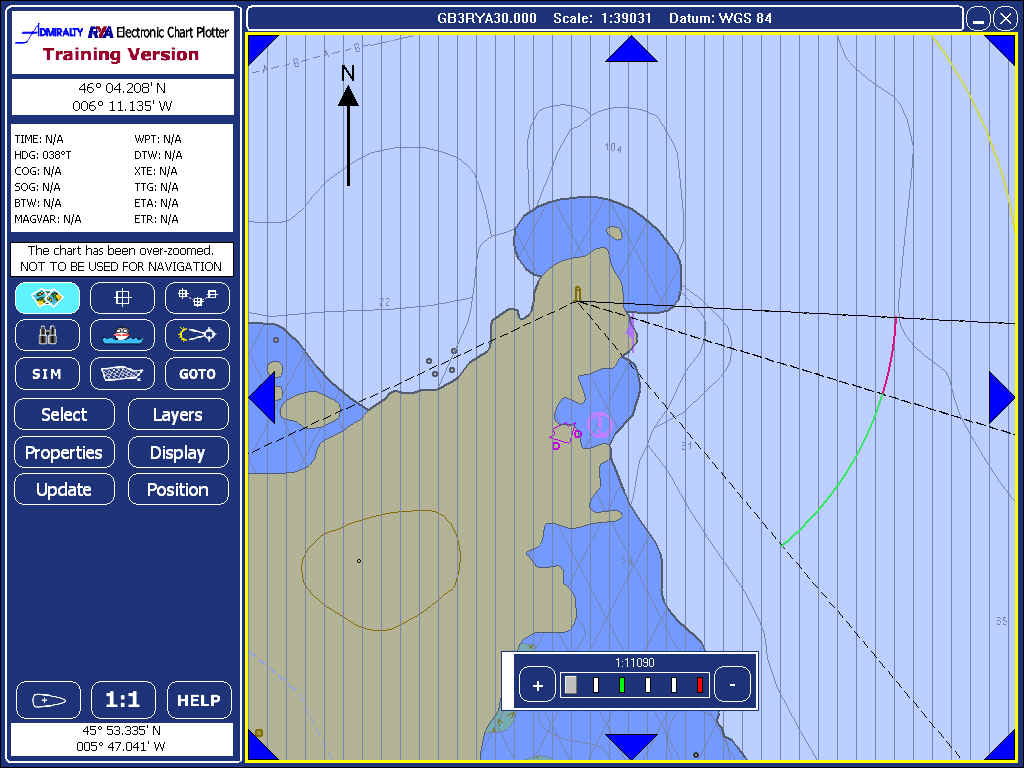
Important You must look at the different levels of detail between the Vector and Raster charts. Click the chart icon the select. Choose Raster No 3. Now zoom in on Christopher point light house ( Slade island) Note it is on top of a cliff and what the light characteristic is and its height above MHWS. Now open the Vector chart and look at the same area. no cliffs and no info! Try using the levels button to get the information. (You wont find it) and that's why I'm asking the question! vector charts have there place but be careful what you buy! If your GPS broke down and you tried to use this vector chart with " steam driven techniques" eg identifying a piece of land with a hand bearing compass from its topography, you couldn't do it with this chart. if you had the Raster version you would be fine. Trouble is a Scanned chart is exactly that. Scans use loads of memory so you cant get get many on a CD! vectors are digitised and use much less memory. It easy to store the whole world on one CD if you use vector charts so this is what the chart makers are doing. It is possible to get good representation of the land on vector charts, but they are very new and come at a very high price ( 14 12 09)
I might add that I have found the plotter to work very well indeed in
reality ( out on the water) with a notable exception.
|
 Water
track is the course through the water a vessel makes.
Water
track is the course through the water a vessel makes.