|
Raster and Vector charts
There are two main types of electronic charts.
Vector charts are more expensive and you can add layers to these. eg If you have tidal software you can overlay the tides
on your vector chart. You can choose to show various types of information
from a menu. For example you might only want wrecks that are dangerous to
your vessel to be shown. Or you might want all the light sectors to show ( or
not! I find this particularly infuriating. I always turn off lights or I have
the chart flashing away and have no idea whether the AIS is warning or
whether it’s a light blinking. information overload! Keep the chart
uncluttered. They also have a greater zooming in facility. As you zoom in you
will get a more detailed picture. However you can zoom past the scale at
which the chart was originally made and this will give you a false sense of
security, as the vector chart is only as good as the paper one it was
produced from.
There is a major problem with some vector charts these days " Navionics" are a case in point. They produce
electronic charts for computers and plotters. The detail in the water is very
good as you would expect and I have no trouble with that. However as you will
soon be aware, it is very important to check the your plotter / GPS fix is
correct The easiest way to do this is take a quick bearing of a high bit of
land or a cliff for example
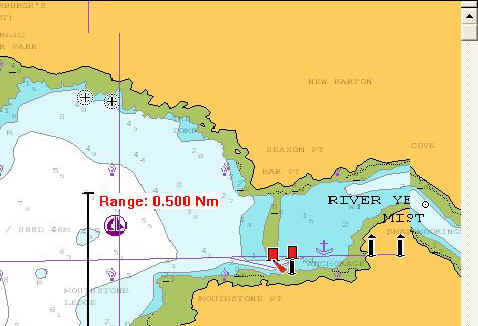 
As you can see with a raster or scanned chart you have contour lines,
buildings, cliffs etc to check with, but not so on
the Navionics charts. For example we can clearly
see that the back transit mark is on the 20 m contour line on the Raster
chart but you would believe from the look of the Navionics
chart that the land was flat, treeless and there were no cliffs !
All well and good if you are going to rely on electronic charting never to
fail, but if you want to check it?!
More on this subject in module 3.
Raster charts are scanned Admiralty charts with the same familiar look
as your paper ones. Because they are scanned, as you zoom in you will
eventually start to see the little square "pixels" of the screen.
How much you can zoom in on an area rather depends on how big your screen is.
laptop computers these days have larger screens and are quite sufficient, but
watch out! big screens eat electricity. you cannot zoom in further than the
original chart scale, unlike the vectors above.
Obviously it is cheaper to produce CD's than to print paper! Raster
electronic charts are considerably cheaper than the paper originals. You do however need a computer on board and
the software programme. People say " What happens when the PC goes
pop"? Well there is no reason that you cannot print off some paper
charts from your CD before hand as a back up. They will be rather small if printed on a normal
A4 printer but if you can get your hands on an A3 printer they are a good
backup. The ink fades though and it is not waterproof, so watch out.
Another good back up is to send a copy of your route to the GPS receiver.
This does two important things. It means you can power down your laptop as they
are very hungry for electricity. And if the laptop goes wrong for any reason,
you have the route in the GPS so there no real problem.
There is another way of backing up your laptop chart and that is to send the route to the GPS set. This saves a huge amount of power as
you can then shut down the computer. Your GPS will then give you courses to
steer and distances between the various waypoints on your route. Why not just
enter the way points manually? Well, With an electronic chart you just click
on the chart where you would like a waypoint. There is no human error. eg, entering the wrong lat lon in the GPS! Or taking the wrong lat
lon off the chart! (We've all done it?!)
With electronic charts, you have the added advantage of having your GPS
position shown on your screen. Very useful in deed! BUT be careful here, some
systems will switch to Dead reckoned positioning if they loose the GPS signal and they don't always have a warning
beep!
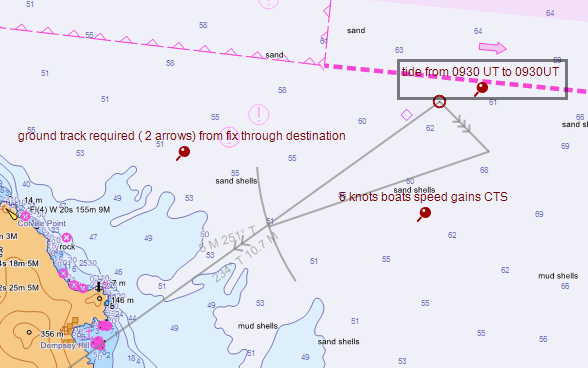
The system we have aboard allows the
plotting of vectors and other “steam driven” navigational methods, which are
essential.
Having a computer aboard has other uses as well. There are tidal
prediction software packages. They can tell you the tabulated height of tide
for anywhere any time! and if you have a modem, you can get great weather
information from the internet.
A few words of advice about computers. First, you do not need a state of the
art machine to run this software! and the machine will inevitably get broken
due to life on board. So don't buy a new one. £200 will get you a machine,
second hand, but it will do the job. A serial port is a must at present as
GPS manufacturers have not yet got into USB technology. Get a machine which
runs as near twelve volts as you can! (Most old laptops run on about 15 volts
but will accept 12 at a push and still work OK. Inverting is very expensive
on power. That is transforming from twelve volts to 240 volts and then back
down to 15. You can get “step up” transformers which take the volts from
12 to about 19 and this is much more efficient. Use an old PS2 mouse
and not the touch pad! As soon as this gets wet you've had it! You are going
to need a CD drive for up loading the software from disk.
More in Mod three.
More and more common these days are electronic chart plotters. These
devices have screens that you can normally see on deck in day light, which is
great. They do everything an electronic chart on a laptop can do except they
use there own GPS and you cannot send route data
out of them to other back up GPS sets. The plotter is the GPS. It is also the
radar screen and you can over lay the radar image over the chart! fantastic
and fairly expensive!
Lots more
|