NB. Only a sample, lots chopped out.
Interaction between highs and lows
This is very important. The proximity of highs to lows governs the strength of the wind and its general direction. The closer they are together and the wider the difference in pressure, (gradient) the more wind. If for example we have a large high of 1040 mb's over central France and a Low over the centre of UK, there will be westerly gales in the English channel. Or a high over the UK and a low over the Baltic will give strong Northerly winds in the North sea.
THE COLD FRONT
The warm, wet air is slow moving and the cold, drier air moves much faster. The whole lot is spinning and therefore the Cold Front is always catching up with the Warm Front. I like to think of the Cold Front as the bulldozer of a frontal system, forcing the warm wet air forward and upward before it and eventually overtaking it. By the time the Low reaches the UK, the Cold Front has normally caught up with the Warm Front around the middle of the low and formed an occlusion.
Because the warm, wet air is being forced up quickly, it loses temperature and the water within condenses into rain with very large droplets. This falls as heavy showers around the Cold Front. Sometimes this rain is forced up by rising warm air, to great altitude where it freezes. This can happen many times and result in hail. Cold air falling next to warm air rising creates a lot of friction and this we hear and see as thunder and lightning
I have drawn the fronts as lines. In fact they are a chaos of mixing air which may cover many miles.
is completely different. It is not driving, it is being driven. Air is
compressible and the violent push from the Cold Front is not felt as such at the
other side of the warm air sector. The warm, wet air is gently coaxed up and
over the cold air in front. This process is gradual and therefore the onset of
rain here is also slower. First there is light rain and drizzle, which
gives way to heavy and prolonged drizzly rain within the warm air
sector and shortly before it. At some indeterminate point through the Warm Sector, this heavy rain
becomes more isolated. This is a time to be careful.
The rain stops, the vis starts to clear and we start to relax. watch out
because the Cold Front will then make itself felt and give heavy showers. After the
passage of the two fronts, the showers will slowly die out.
As the name suggests, these are a mixture of both warm and cold fronts. You
may get any of the features of either fronts. As the cold front is travelling
faster than the warm, so both fronts occlude.
This happens quicker the nearer you are to the centre of the depression. Typically
these occlusions are the sign that the low is filling and dying out. However a
new low may well form at the point where the two fronts split. This is usually
to the South East of the old parent low. This new or secondary low can be much
more vigorous.
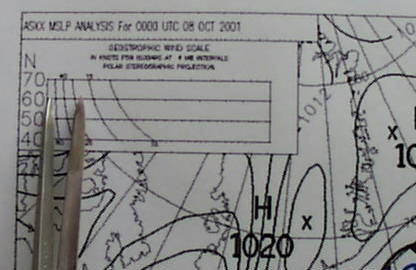
Geostrophic scales
Use your dividers to measure the distance between two isobars, (be careful of
damaging your screen) then using the scale at the correct latitude, find out what
Beaufort force is likely at that time.
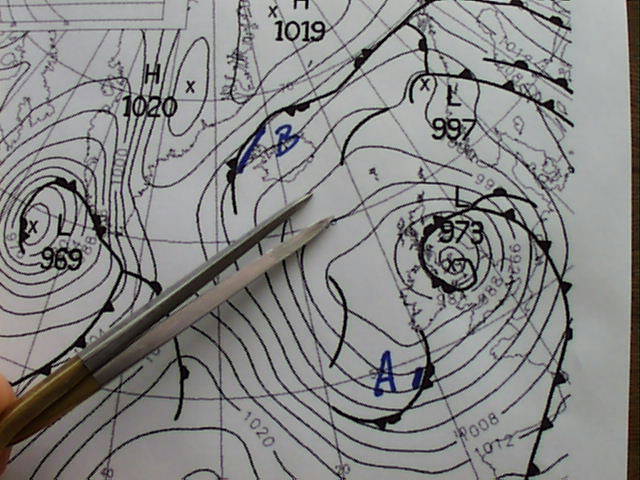
On the south coast it was pretty breezy that day! You can obtain a rough
speed of a front in a similar way. By measuring between isobars at the front.
Occlusion "A" was three hundred miles from Plymouth and travelling at
40knots. This was an 0600 synoptic and the front arrived at 1300. Right on
time!
Occlusion "B" is travelling much slower. About half the speed as it
takes much longer to cross between isobars. With the correct scales, you can also measure the speed of warm cold and
occluded fronts. This is
particularly useful, as then you can work out roughly how long before they hits or
clear your area!
You must be careful here though, as the frontal weather will arrive before the
synoptic feature. for example, rain fall starts well before a warm front
arrives.
Synoptic charts are normally issued at 0000UT, 0600, 1200, and 1800UT.
It is very important to understand that they are pictures only of those times.
If it is 1000UT when you look at the 0600UT chart, then things will have
changed! Use the methods above to decide where fronts are in real time.
The Beaufort Wind Scale is a way of telling the wind speed by looking at the sea state.